IFFR
Dashboard
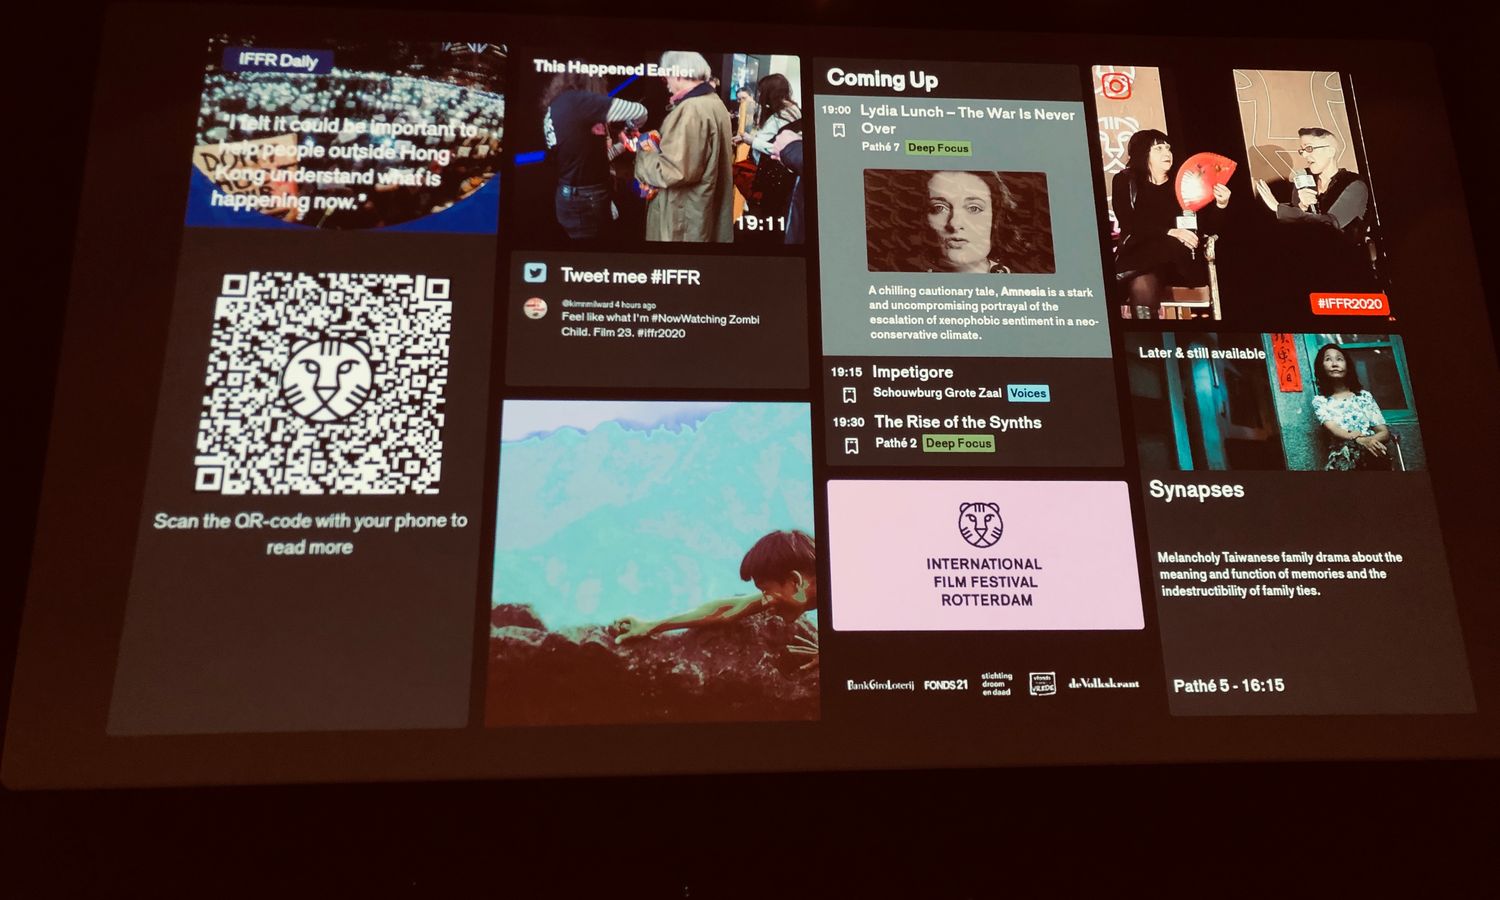
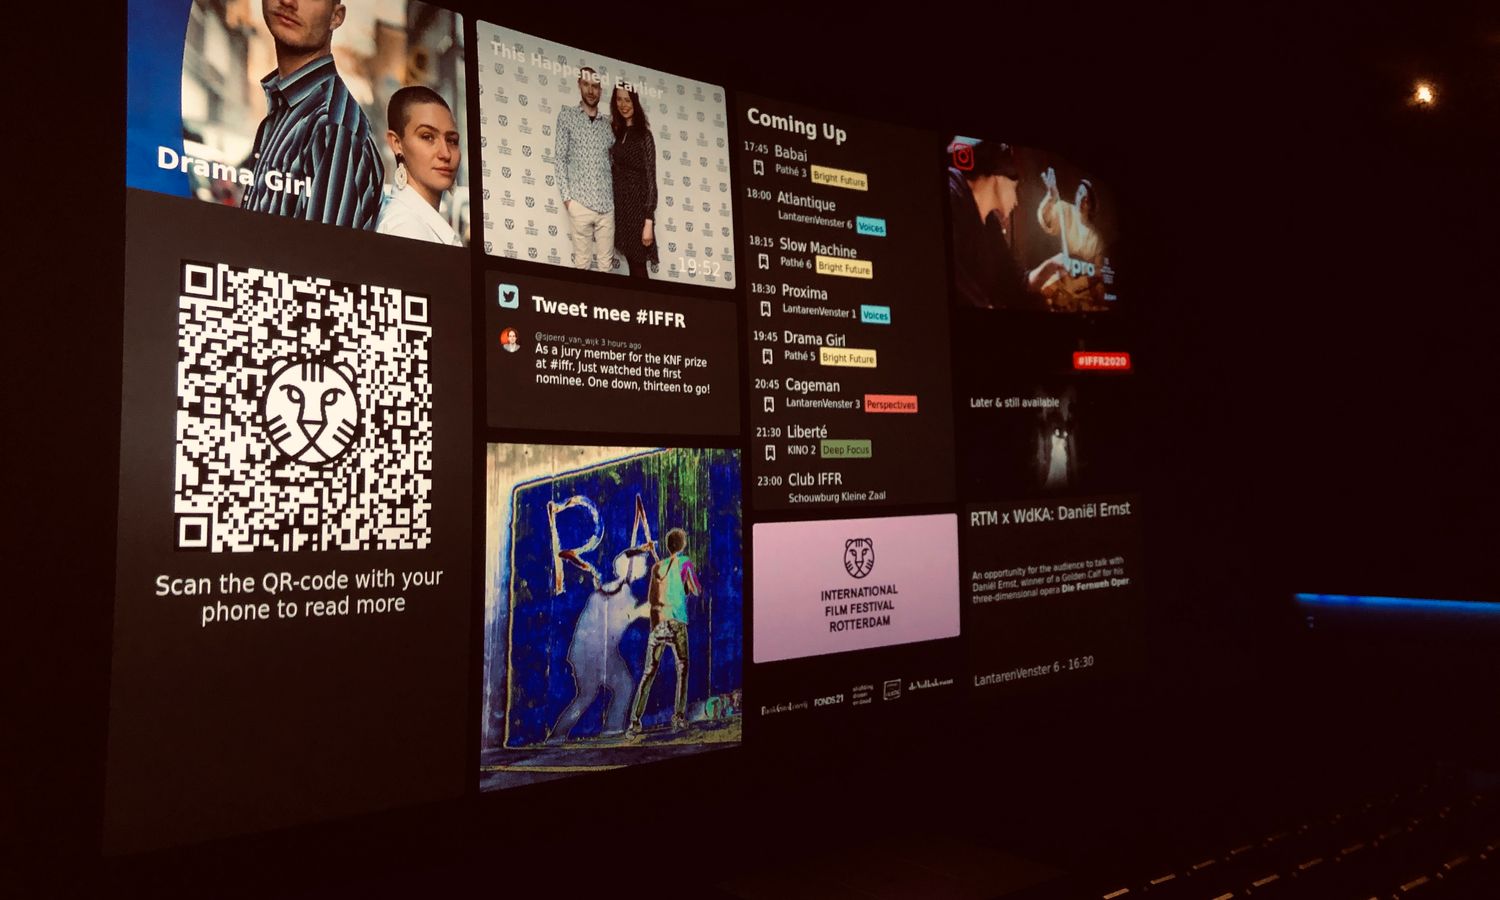
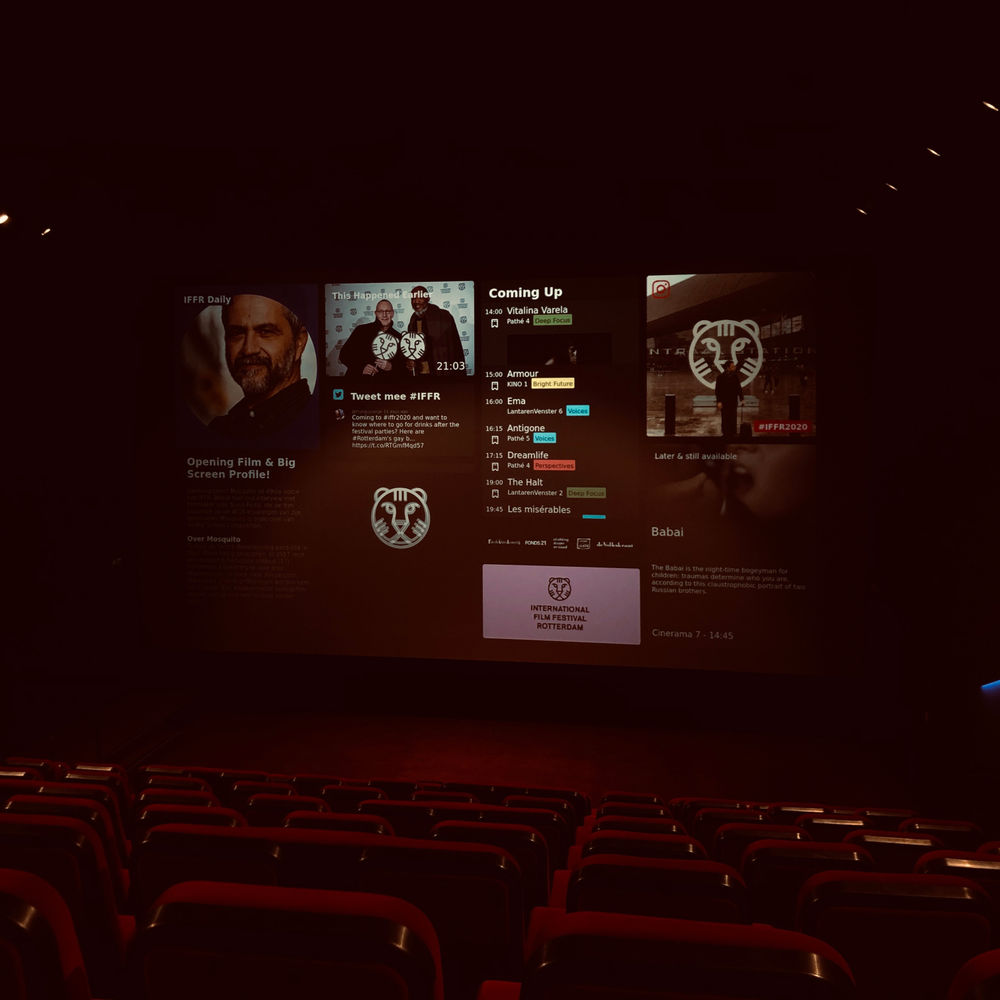
In the spring of 2019 I worked on my graduation project for the International Film Festival Rotterdam. Every year at the end of January and the beginning of February the International Film Festival Rotterdam is hosted, attracting hundreds of thounsands of visitors. Before a film starts playing a dashboard with information about all aspects of the festival is shown on the big screen. The dashboard used by IFFR up until 2019 was getting outdated and was not very user friendly to work with for the dashboard directors. My graduation project was in the theme of creating a better dashboard.
Building a custom experience
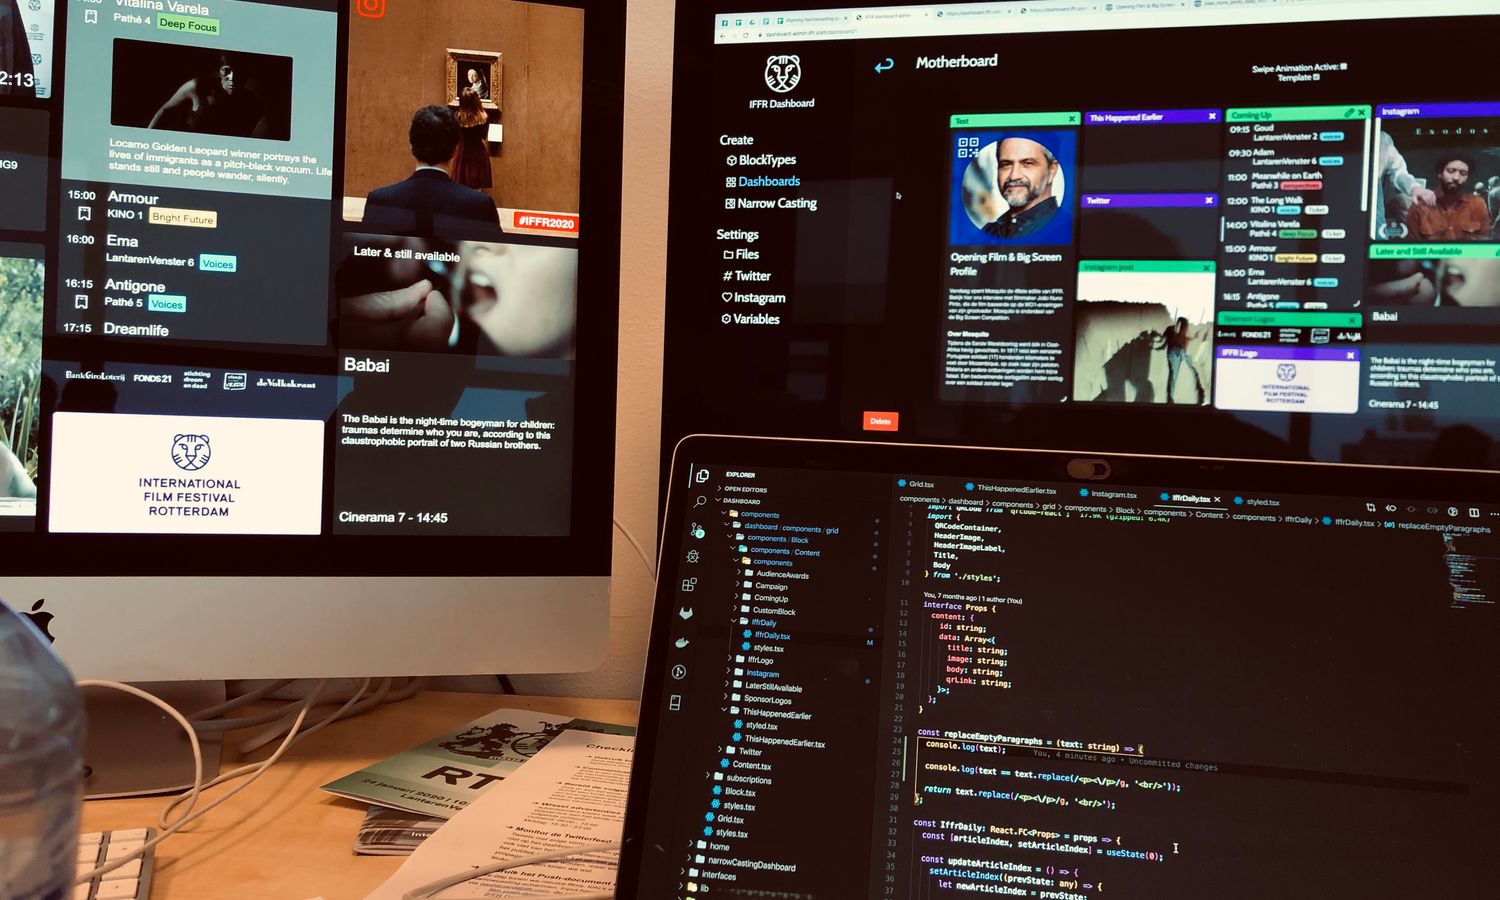
After doing a ton of research about what the dashboard must be capable of doing and the way the dashboard directors used the currently existing dashboard I created a plan to make my very own custom experience. Because the various information blocks on the dashboard were all very different from each other and held their own custom content, I knew it would be best to create a fully custom CMS that would exactly fit the needs of the dashboard.
Because the dashboard consists of various different blocks with information I thought it would be best if these blocks could be placed in any way shape or form. Therefore the block placement was done using a drag and drop system, in which the dashboard directors could also change the size of the block. This gave the dashboard directors the freedom to create different dashboards according to their wishes. Also the content itself was easy to add. Because I had access to multiple API's with all the festival information and ticket information I could make easy to use interfaces for the dashboard directors in order for them to not make a mistake by placing wrong information. And example of such an interface would be for the Coming Up block, a block that shows which films are coming up later and which of these films still have tickets left to buy. With the data gathered from these multiple API's I created an overview with all upcoming films and their respective available ticket data, out of which the dashboard directors could easily choose whichs films to show in the block. In this way every one of the ten blocks had it's own optimal way to be created.
Technology
The project consists of multiple frontends, one admin environment for the dashboard directors, and the dashboard itself. These two frontends are connected to the same backend. This backend is a TypeGraphQL API built in TypeScript with a TypeORM connection to a Postgres database. The two frontends are both built in React also using TypeScript. This project was the first time I used GraphQL and I immediately fell in love with it. The ease of use it brings me as a developer is very valuable, therefore I'm sure I'll use it in the future. Another new technique I used was GraphQL subscriptions, which uses websockets under the hood. This technique made sure that as the dashboard director were editing the dashboards, these dashboards would also be updated once saved.
In the end the project turned out to be way bigger than just a graduation project, therefore I kept working on it after I graduated, because the cool thing about this graduation project is that it was actually going to be used in production. I've worked on this project in total for over a year, and along the way I learned a whole lot of things about the technologies used, and the way to handle a project all by myself. It was an amazing opportunity for me, and I enjoyed every bit of it.